You’re waiting in the long line leading to the school entrance. Your car is stuck in bumper-to-bumper traffic, crawling forward at a snail’s pace. In your left mirror, you spot somebody walking to school, their paces slowly catching up to where you are in your car. A bike whizzes by, the person on the machine booking it toward the entrance. You wonder, “Would it be faster to bike? Or even to walk?” You take a glance in the rearview mirror, a bus whizzing by on its way to drop off its students. “Or even to take the bus?”
In order to measure how long it takes to get to school, we first find an average starting point. In order to do this, we need to find the population and population density of the Lightridge High School zone and find the most average place that people live. Luckily, the United States Census Bureau has done the job for us.
The above map shows the Lightridge High School zoning map and what census areas it overlaps with. It includes total population on the left side of the swipe bar and population density on the right side of said bar.
I’ve chosen to take a closer look at the western census tract that is highlighted in pink below. This is because it is the tract with the highest population density. However, I offset the point to the east due to the fact that there is another census area (also highlighted in pink) with a high population directly to the east of this tract.
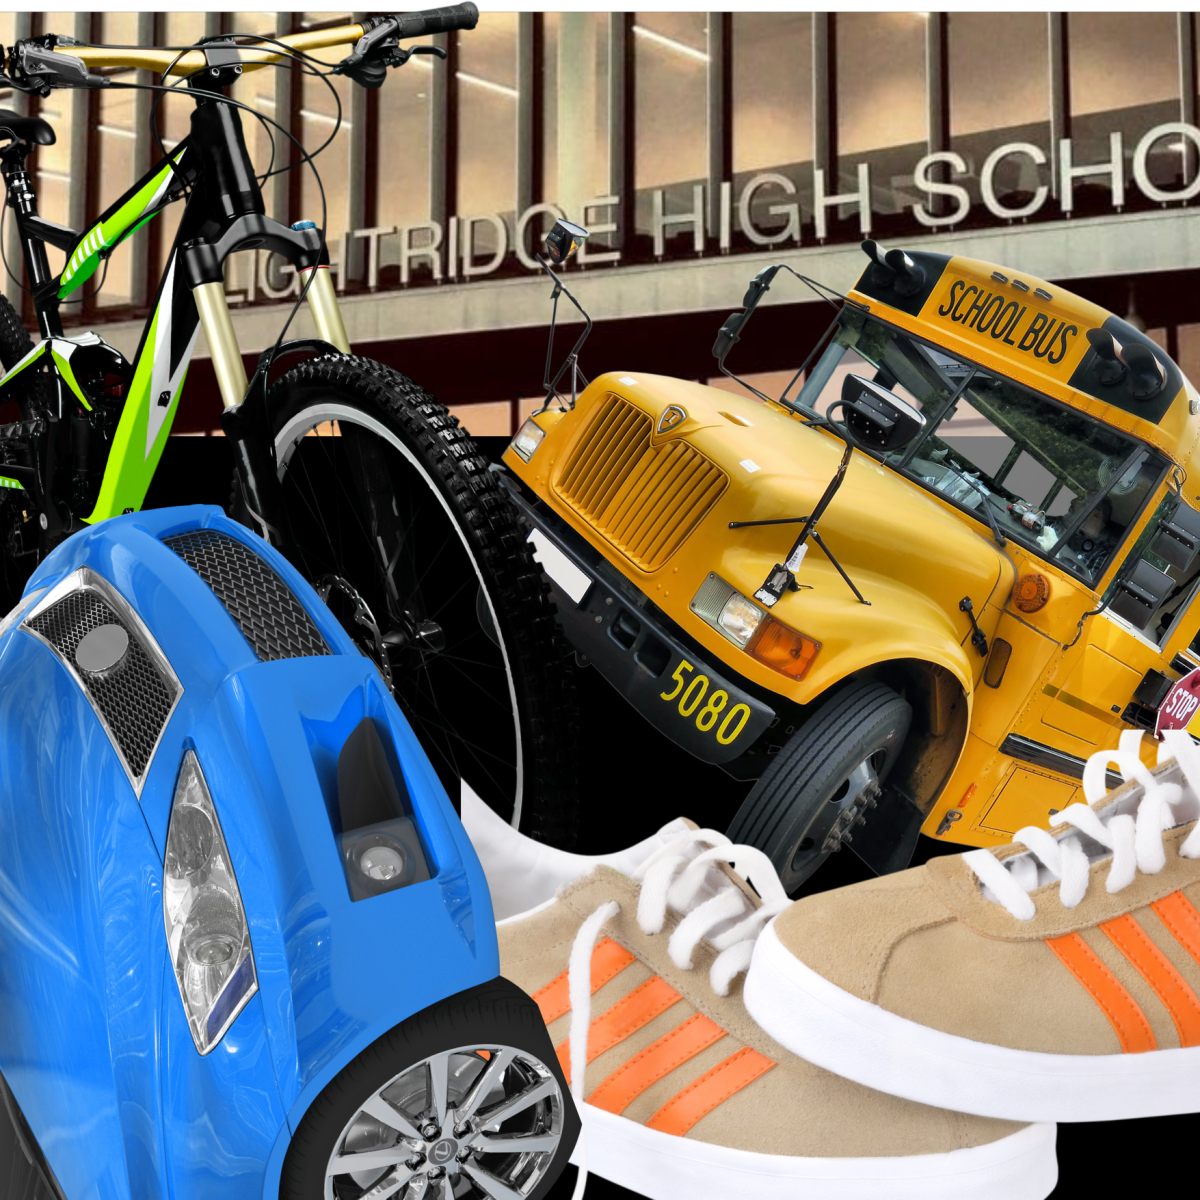
Knowing this, I set a goal of arriving at school at 9:20 for all four methods (driving, taking the bus, biking, and walking) and enlisted the help of three classmates as well as myself. Without further ado, here are all of the ways that I chose to get to school.
Driving
Driving took Student One 7 minutes and 35 seconds. This was mostly due to the traffic on the line coming into school.
The bus
Taking the bus took Student Two 10 minutes and 47 seconds. This increased time compared to driving was mostly walking to the bus stop and extra stops compared to driving. However, the bus didn’t have to deal with as much traffic as driving as the buses have a dedicated loop.
Biking
Student Three biked to school from the starting point which took them 4 minutes and 53 seconds. This time is faster than driving because they didn’t have to deal with traffic on Collaboration Drive and didn’t have to make any stops.
Walking
Student Three walked to school from the starting point which took them 17 minutes and 30 seconds. This time is the slowest.
If you want to get to school the fastest, the best option seems to be biking as bikers don’t have to deal with traffic or stopping at bus stops. The next fastest option would be to drive to school. However, you would have to deal with traffic at the entrance even though the rest of your trip would be faster than biking. The second slowest way of getting to school would be taking the bus. It would take a shorter time than the car, but because you have to walk to the bus stop as well as stop at other bus stops before arriving at school, the lack of traffic can’t make up the time compared to the car. The slowest way of getting to school is walking.
So next time that you’re stuck in traffic, know that aside from that bike whizzing by, you’re on the fastest route to get home. And if you want to get to school faster, maybe it’ll be faster to brush the dust off of your bike, pump its tires, and ride to school.